


Years ago I began to track when the S&P 500 would move through its next one hundred point level. As an example, 4100 to 4200. This year the S&P 500 began the year at 3756.07. So its first break through level would be either 3800 or 3700.
Luckily, this year has seen the S&P 500 move in one direction, upward. The table below shows the level, how many times it took to close above that level, how many months it took to close above that level and name the months.
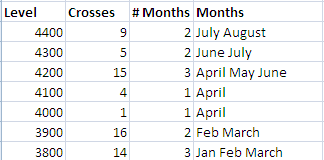
Clearly, the move above 3800 took a while to complete. Then 3900 was not quite as long. 4000 and 4100 levels took no time to clear. Then 4200 took a while and the move through 4300 was fairly quick. 4400 was a challenge and now we are a bit less than half way to 4500.
It is interesting to note that so far we have not retraced these levels in a major way. A big retracement would be moving back below 4400, then 4300 and finally below 4200.
In tracking the S&P 500, we actually use SPY instead of the S&P 500 cash to calculate the number of crosses. We like that SPY has volume in addition to price which helps as we dig through the weeds.