


Has The S&P 500 Started A Bear Phase?


Back on May 15th we wrote a piece entitled “Has The S&P 500 Started A Meaningful Rally?”. We noted that Thursday, May 12th saw the S&P 500 via SPDR S&P 500 ETF (SPY) hit a low for the year of 385.15 at 1:48 p.m. EDT and by the close of trading was at 392.41. Friday, May 13th saw the QPI Liquidity Measure remain positive until it turned negative at 12:51 p.m. EDT into 2:42 p.m. EDT.
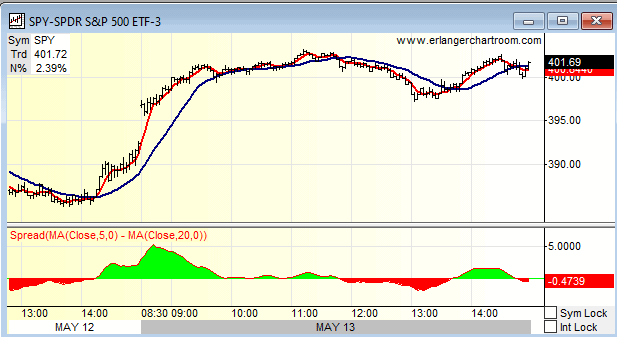
Then liquidity turned positive again into the last hour of trading enabling SPY to rally back above 400 and close at 401.69.
That fact that SPY did not collapse and break below 397 on that Friday was telling. Instead SPY rallied back in the 3:00 p.m. hour. Liquidity did turn a tad negative at 3:48 p.m. So we waited until the following Monday morning action with some anticipation.
That Monday the S&P 500 closed at 400.09 and then rallied the next day to close at 408.72. It looked like we were off to the races, almost.
The rest of the week the S&P 500 dropped to close that Friday, May 20th at 389.63. So much for the rally idea. Right? Well the following week the S&P 500 rallied to close the weekend going into Memorial Day at 415.26. up 6.58% for the week. We had our rally.

For the next 7 trading days starting on May 31st through this past Wednesday close, the S&P 500 traded mostly between 415 and 410 with a high of 417.44 on June 2nd and a low of 406.93 on the first. The rally seemed to be consolidating and we noted that on Twitter (Bullet86) that:
“Looking at intraday action from life post Memorial Day, $SPY(options or stock) above $415 have no traction and trades below $410 even less traction. Today is 8th day of this top of $410 to 415. Trend is range trading - avoid chasing until it does move out of range.” June 8th at 6:04 p.m. EDT.
While this move was underway we noted that the bigger picture of bias in our work was negative on a monthly and weekly basis but the daily basis had turned positive.
Bias tells us whether we want to be long or short. After Tuesday, June 7th the weekly bias for the Russell 2000 ETF (IWM) and SPDR S&P Midcap 400 ETF (MDY) had moved back into their weekly DMA Channels from below. Just as soon as they got into their weekly DMA Channels, they broke back below.
Then they broke their daily DMA Channels just as quickly as they were established on this week’s Thursday and Friday drops. SPY now sits at 389.80 just above the yearly low of 385.15 noted above.
The bears have been in control for the last 5 and a 1/2 months and with this two day drop we have to wonder if a new low for the year is coming this week? The Federal Reserve Open Market Committee (FOMC) will announce their latest interest rate decision on Wednesday. But first the market has to live through the second inflation stat on Tuesday as PPI is released on Tuesday with the estimate at 0.8% from 0.5% last month.
Most think the FOMC will raise 50 basis points but some think it might be 75 or even a 100 to slow down the torrid pace of inflation that saw CPI come in Friday at 1.00% against a consensus of 0.70%. So the market faces another case of “waiting for Godot” like it did last week in waiting on the CPI number with both PPI and the FOMC.
So how do we play next week? Of late, Monday mornings have been “sell the market” events. Either straight down on the Monday open or down with an attempted rally that fails later in the week. The exception was last Monday where SPY had a gap open.
It makes sense to “expect the unexpected”. That means having lots of cash and not making big bets into the Tuesday or Wednesday numbers. There will be plenty of opportunity to do so after these events play out. In the meantime, be aware of retracement levels below.
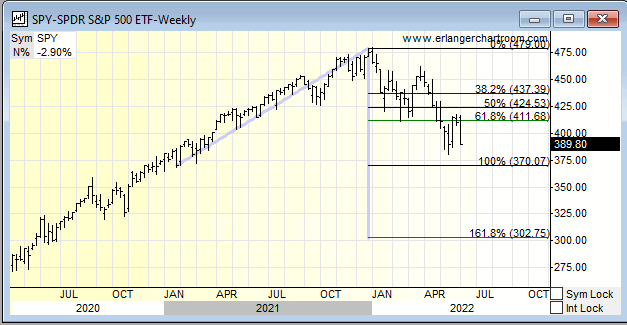
The reason we are using this retracement is when you looking left on a daily chart there is no support. So we have to go to a weekly chart. Then we have to use a level that has not been tested.
Currently, that is the January 2021 low at 370.07 and the 100% retracement. So much for the 380 level, lots of pundits are talking about as a soon to be tested but there is more to test. All clear would be getting back above 411.68 which is the 61.80% retracement.